


How to find opportunities in TV & streaming; tools to evaluate social performance; Apple TV's $1bn loss
Get a discounted ticket to C21's Create London on April 30th.

Just another quick reminder to get your ticket to Create London on April 30th; a new one day event from C21 to bring together everyone across the full range of the creator economy - TV/film producers, creators, online platforms, brands, partners and AI tech.

Join the Evolution of the Creator Economy at C21’s Create London Festival
C21’s Create London Festival is a one-day event on April 30, celebrating the creator economy and bringing together creators, TV/film producers, digital platforms, commercial partners, commissioning brands, and AI technologies.
Be part of the creator economy’s next chapter - secure your place today HERE!
Exclusive Offer: Business of TV subscribers receive 20% off the current ticket price with code VIP20 at checkout.
—
How to view complexity (and find opportunities) in the advertising and TV markets
I’ve written a lot about YouTube, and why it is clear if things continue as they are (and curve balls are always possible) it will be a big part of the TV viewing experience into the future. Indeed, if you missed it from earlier this week, here is a list of some cracking scripted web series from the past 20 years:

To illustrate this point, the graph below shared by Maria Rua Aguete of Omdia shows that within the next three years, 45% of the revenue of the media and entertainment market will be online video. And although 70% of the revenue will be TV & online video, only linear TV is predicted to decline. Overall, the market is going to grow from $1bn to $1.2bn, and more than half of that growth is in online video, with only slight upticks in music, games and cinema. (Games is a whole other story, see the section below).

As we all know, online video is already a big part of the media mix. However, underneath this broad change, things can be much more nuanced and complicated, and sometimes this complexity is lost in the conversation.
The recent TV Trends 2025 research from Thinkbox (the body representing commercial broadcasters in the UK) is really worth your time - especially the first video presentation by Anthony Jones, Head of Research:
These reports reflect a much more nuanced and dare I say it positive picture than how it feels in the industry right now. Easy to say, when so many broadcasters, producers and production companies are really feeling it.
Understanding what is going on under the surface is key to being able to sense what is a permanent structural shift versus a trend that will wash through. The key to this understanding is really getting to grips with what the twin trends of convergence and fragmentation mean in practice. It doesn’t mean one single winner (Netflix or TikTok or games), nor does it mean one single behaviour (“everyone’s watching YouTube” or “no one watches TV anymore”). Rather, it is the breaking down of the barriers between what were multiple distinct markets into an amorphous, shape-shifting blob - this is called convergence. And simultaneously, the enormous amount of choice means audience behaviour splits out in an endless myriad of different ways - this is fragmentation. And these twin processes can involve a level of destruction, not just of existing business models, but also of gatekeepers and businesses themselves. Crucially, they also bring an acre of opportunity for those with the mindset and the hunger to go hunting.
To illustrate how important it is to understand this complexity, analyst Ian Whittaker (quoted in the Thinkbox report above) makes the point that the growth of the digital ad market over the last 10+ years could be viewed as being driven by small to medium businesses - so think of all those businesses on Etsy or social selling products and services all over the world. And these SMEs are not really in the market for the big ad spend that powers TV, streaming, cinema, radio, print etc. As Ian said:
I suspect (it) is the spending online from Small and Medium Businesses which has powered growth in digital… it is their “shopfront” cost and has replaced property costs.
Meanwhile, TV and online video is (generally) all about medium to large advertising companies (MLAs). And yet 80% of Meta’s revenues aren’t from these MLAs. And between 34 - 45% of all digital ad spend comes from those small to medium sized businesses.
Therefore, while the total ad market is around £40bn, when you remove all the activity of the SMEs and focus on the medium to large advertising companies, it is £16bn. And of that £16bn, 37% is on search social and display. And you can see below how much of the spend is with linear TV, broadcaster VOD (BVOD) and online video below.

In a similar vein, Thinkbox has also dug into the YouTube numbers and demonstrated that here in the UK, 90% of YouTube’s viewing comes from 25% of the audience. In comparison, viewers on a TV set are much less skewed. In other words, while the vast majority of the population say they are YouTube users, the bulk of the viewing is from a minority of very heavy users.

Anthony Jones pointed out that while Nielsen’s The Gauge has YouTube’s share of TV viewing in the US somewhere around 11%, here in the UK it is closer to 7%. Worth noting that these numbers below are only 16+ so will be different for those below 16 - assuming more YouTube and less TV.

The point that Thinkbox is making is that there is a perception distortion effect going on in terms of what we understand the audience behavioural change to be, and then from that how we consider the health of the ad market from the TV and online video perspective. As in, we perceive the speed and completeness of the change of audience viewing habits away from TV to be much more profound and monolithic than it is, and we also believe the state of the TV ad market to be worse than it is because of the inclusion of ad money from SMEs who don’t and aren’t spending on TV or streaming advertising anyway.
And this type of complexity exists in all sorts of other areas. Is cable TV in decline in the US? Yes of course. Is it still a profitable business model? Yes that too. Does the decline come evenly across all demographics and audiences? No. Are valuable audiences for individual channels still holding up? Often yes. So for example, you might see a channel’s audience number overall being down, however if they are targeting a specific demo - older males, or youngs, or AB1s or whatever, then this is how they evaluate their success as advertisers are targeting these specific groups. And this complexity is true across all media, all territories, all demographics. Another example is Twitch - it barely registers as a platform on any of the reports into online viewing, however for a subset of teenage boys, it is their number 1 destination with hours clocked up every day, thus going some way to explain why Amazon bought it for $970m in 2014 (and why other gaming companies had been sniffing around it too).
So what does this mean for TV producers especially those really feeling the pinch right now?
Well, I talk to many people across the industry - from TV producers to digital content companies, marketing and product people, tech to financiers (feel free to get in touch!). And my very broad observation is that what has happened is a really big shift in what producers need to understand and care about.
As B2B (or in truth, B2B2C) businesses, producers - both owners of production companies and well as freelancers - have in general not had to have a complex and detailed understanding of the business side of the market up until now. Instead, it has been about ideas, personal networks, ratings, creative trends, new talent, skills and reputation. It is about the programmes, the films, the formats; which companies are looking to staff up, what are the commissioning priorities, what is getting commissioned, who is hot, what is the performance of each channel, who is moving where, what sources of project finance are there, what companies are being bought and so on.
The revenue, distribution and marketing engines of our industry have in general not been something to be concerned with, as they are specialisms in their own right separate to the art and science of developing ideas, pitching, winning commissions and making the shows.
However suddenly, having a sense of changing behaviours, how to monetise shows, how to develop ideas for online niches, and how to build, reach and retain audiences really matters. And it is incredibly hard to get a quick handle on what is a complex, nuanced and tricky ecosystem.
And in that spirit, the Thinkbox research is a reminder to us all that anytime we make sweeping or absolutist statements - TV is dead, YouTube is it, Netflix has won, no one reads books, podcasts are where the money is, the metaverse is the next big thing, AI is going to replace us all, you can fill in your own here - is to pause and remember the very nature of convergence and fragmentation means increasing complexity and ambiguity. And the bit to focus on is that this ambiguity creates space, and in the spaces lies a whole host of opportunities. The challenge therefore, is finding those opportunities, knowing what to pursue and what to bypass, and being able to identify the right time to take a leap.
In a (rather large) nutshell, this is why I started this Substack specifically to try to do three things: 1) help producers further develop an understanding of the big shifts in our industry and all the complexity that involves 2) find ways to grab the opportunities that are out there and 3) understand how to make money. I’ll leave you to give me a score on how well I’m doing against these three ambitions…
Apple TV+ reportedly losing $1bn on content a year

The Information has a report that has been widely picked up that Apple TV+ is losing $1bn a year on its content, for example:
Others have written about it in great detail, so I won’t cover that ground here, except to make a couple of observations.
Firstly, having worked with many engineering and technology companies in my time, perhaps don’t underestimate the allure of red carpets and glossy premieres for those in dare I say less glamorous industries. And when you are in a company that made $94bn in net income last year, then there might be slightly more tolerance for these losses than other less shiny activities.
But secondly, this tolerance surely must only be slight. For those running these businesses, a loss is a loss, and therefore it isn’t unreasonable to assume that the return on investment on this content spend must be more than just the shows themselves and Apple TV+ as a product. How Apple evaluates this content and product spend is not publicly known, but if you look at it through the lens of keeping people within the Apple ecosystem, then perhaps there is some sort of metric to track lifetime value of users to Apple overall, rather than strictly Apple TV+ subscriber numbers. So in hugely simple terms, people come in for Slow Horses and end up buying AirPods or a new iPad. That prompts the question, would those people have bought these products anyway? One of many bits of data their analysts will be pouring over on a daily basis, safe to assume. This is all part of the same point I’ve made numerous times about how the streaming wars may be over, but the bigger fight is over keeping users within an ecosystem, and how TV content, games and services is a great way to do just that. This is the point being made in the Verge article below:
Thirdly, the overall low performance of Apple TV+ is highlighted by many - less than 1% of TV viewing, according to The Gauge. However, it is worth remembering that The Gauge only tracks US usage, and for those platforms with a global offering - Apple TV+ but also YouTube and Amazon, and increasingly brands like Max and Tubi - then these numbers don’t tell the whole story about what an individual platform is doing in each company’s key markets.
Fourthly, a key point of difference between Apple TV+ and other streamers is the size of their catalogue of films and TV shows that comes with the subscription. Apple has its own originals, plus you can pay to sign up to lots of channels as well as Major League Soccer. However on all the other platforms comes a high volume of old films and TV shows of varying quality and appeal. Apple only offers a selection on a paid basis and not part of the subscription.
Will this change in the future? With the back catalogue of - say - Warner Bros. Discovery, Apple TV would in one fell swoop gain an enormous archive that is likely to increase not only subscriptions but time spent with the service. Easy to say on the outside of the company, and there will be logic and compelling reasons for why they haven’t yet gone down the volume catalogue route.
There are many things to keep an eye out for, and while Apple may currently view their content spend as a thing of value to the overall business, it will be interesting to see if this changes in the future.
Pact’s report into the independent production sector
This report came out yesterday, so I’ve not had time to delve into it in any great detail. However, anything Pact produces is very much worth reading, so have a spin through it here, and I’ll come back to it next week.
Tracking forecasts against reality is really helpful, however from a quick look at this latest Pact report, I can’t see a similar graph to the one below, which was by the same company (Oliver & Ohlbaum Associates) but was for an Ofcom report in 2023 called ‘Understanding the UK Production Sector’.

This one is really useful, as it tracks and then forecasts total producer revenues including non-TV activity such as corporate production, online publishing, talent management and feature films, as well as the full range of revenues from international networks and studios, plus other sources of financing and the in-house/external split of UK broadcaster spend. Hopefully an updated version will appear in an Ofcom or Pact report in the future.
The skipping of TV ads hitting other media
… the one-two punch of the collapse in the TV ad market and audiences spending so much less time in theaters (thus seeing fewer trailers) has been disastrous for creating awareness of mid-budget programmers.
It was in response to someone pointing to Steven Soderbergh’s latest film Black Bag opened at $7.6m (off a reported budget of $50m), and it was based on the assumption that people were aware of the film and had chosen not to make an effort to see it.
As
said, if you have a $200m film, then you’ve got sheer muscle to promote and get cut through, or if it is a smaller niche like a horror, then you can be hyper targeted online (looking at the example of Terrifier 3 from last year - they really got their audience to the cinema because they had their own horror fan network to market it to).For mid-budget films, without the exposure of a high volume of people seeing TV ads, then it is harder to make them aware that a film is on at the cinema they might like, and then by not going to see that film they aren’t seeing upcoming trailers, which they might come back to the cinema to watch and so on. Sonny’s point being that the loop has been broken.
As often is the case, it was a lively discussion online, and worth reading the full chain to see a spread of arguments.
Some tools to evaluate online performance
I often get asked how to go about evaluating an online business, channel or campaign. And one of the great benefits of working online is there is a wealth of freely available information, you just need to know the tools to access it, and then have a handle on how to understand the information you can glean.
Here are some online tools that are hugely useful to have in your armoury. As often is the case, this is the tip of the iceberg (and as always, if you want to discuss more, do get in touch).
Website performance
There are a whole range of free and paid tools to check out the performance of a website. They usually have some sort of free offering that you can then upgrade to paid to get the full service, however often the free version is enough at first:
Similarweb - great for traffic analysis, competitor benchmarking especially for larger websites
Ahrefs - the market leader for backlinks (links from websites to pages on a specific website) plus keyword research
Semrush - all in one marketing and performance tool for websites as well as social.
Depending on the website, the main things to look out for are:
Monthly visits - do their visitor numbers go up and down? Is it explained by real world events or some campaign they’ve been running?
Page views per visit - how many pages does each visitor view on average
Bounce rate - the percentage of people who leave a site from the one page they arrive at
Visit duration - how long does the average user spend on the site.
Obviously with all of these, what is good or bad is dependent on the offering. But in general, you are looking for:
A low bounce rate - it isn’t good that people arrive and leave immediately, so getting it to 40% or below is an ambition (although this differs by sector)
High page views per visit - certain websites always tried to manipulate this number by putting content over lots of pages, however if the website is a content offering you’d like to see high page views per visit to indicate people are enjoying or finding the content useful
Visit duration - again, it could be that people are spending a long time on a site because they are struggling to find what they are looking for. Or alternatively, they are enjoying the site and therefore the longer the time the better.
Social
Across all platforms, you are looking for views, any engagement indicators and then lastly subscriber/follower numbers. Each platform is different, but some key things to look out for when trying to understand the success (or not) of an account, channel or activity is to be aware that the big numbers - subscribers/followers, views - can lead you up a garden path. Subscribers numbers can be a vanity exercise as they don’t always translate into views (and views is how the bulk of channels make money). Equally, the lifetime views or engagement/like numbers on a channel might have been clocked up years ago. Also, especially on TikTok, be aware that gaining followers via the boost functionality is fairly cheap, so a pinch of salt around these numbers too.
In terms of some tools with free options:
This tool is part of MrBeast’s empire, and it is really helpful. It also serves as a great demonstration that very few in the creator economy are just doing one thing - multiple revenue streams are the norm, so software as a service is a natural extension of his business. There is a paid tier, however the free option is great if you want to dig into any channel on YouTube.
It also has top channels and top videos, and you can compare channels with each other which is super interesting. So if you look below, I’ve compared Channel 4.0 with Foot Asylum, and you can see how the top line numbers available on YouTube - total views and subscribers - could lead you to one conclusion (that FA is bigger than Channel 4.0) but if you then view by the last 7 days, 28 days, 3 months and 1 year, you get a whole different picture:

Viewstats is a competitor to long time market leader Social Blade, which has performance data on more platforms (Instagram, Facebook and TikTok). It has a range of dashboards, however it doesn’t work as well on mobile, and the user experience on Viewstats is better with more available for free before being pushed to a paid option.
Another great tool for Instagram and TikTok is Phlanx, which gives you three free searches of accounts on Instagram or TikTok, and shares an engagement number - how many people like or comment on a post, which a great indicator of the impact of a channel.

If these examples are useful, I can do more quick summaries of tools and how to evaluate online metrics - let me know if you’d like more of this type of thing:
The state of the games industry & parallels with TV and film
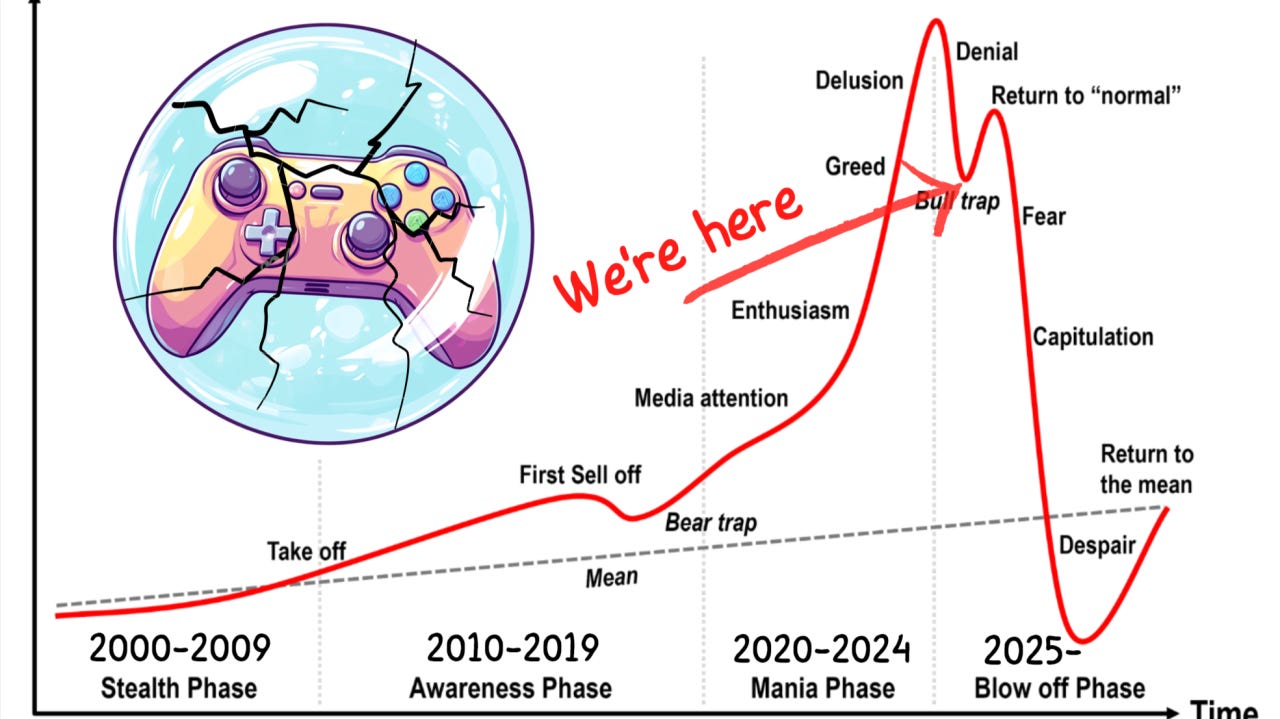
I’ve mentioned this before, however the games industry has been suffering a similar experience to TV and film, with a significant number of job losses, studio closures and games being cancelled.
There are several analysts really worth reading on the games industry - Matthew Ball being the most obvious, here is his latest report:
And this piece by Carlos Viejobueno is worth a read if only to see how he makes a direct comparison between the phases of the games industry over the past 20 years, and those of the TV and film industries.
For example:
Much like Peak TV in Hollywood, gaming saw an oversaturation of content, with too many big-budget games competing for the same audience. Instead of diversity, the industry focused on formulaic releases, leading to diminishing returns.
Similarly, gaming looked to subscriptions rather than sales to provide financial returns, and also is concerned about the future impact of AI on the sector. The piece ends with a call for a return to mid-budget titles rather than the big budget and indie models that exist currently - again, sound familiar? However, as demonstrated above with the case of Black Bag, the ability to successfully get mid-budget cinematic releases to break through is probably somewhat over-assumed.
The 2025 Video Game Bubble has left the industry at a crossroads. Publishers can either continue the cycle of unsustainable AAA development or embrace financial discipline, innovation, and diversification to rebuild a healthier ecosystem. The industry's survival depends on moving away from bloated budgets and reckless investment strategies and toward a model that prioritizes long-term stability over short-term profits.
Anyway, the piece is worth reading to see how comparisons are being made with TV, plus also there is a lively discussion in the comments.
Find out more about me and the purpose of this newsletter, say hi via email hello@businessoftv.com, or connect with me on LinkedIn.