

How streaming delayed TV's disruption
But now it is here, how can TV producers adapt to the new world?

In the last weeks, I’ve had a few conversations with producers where they’ve pondered why TV is facing such upheaval now, when other forms of media - print and music for example - were upended by the internet two decades ago. Others have also questioned if the urgency around adapting to new platforms and business models - YouTube for example, or seeking new types of funding such as brands or self-financing - has been a little over-egged. Haven’t we been hearing about digital and technological change for decades now? Why has it suddenly become pressing in a way it wasn’t a few years ago?
To try to answer that, I thought I’d outline some of the broader trends that have happened within the UK TV market over the past 15+ years, and how they together have brought us to this point. (For the sake of brevity - ahem - I’ve also not included the boom in streamer spending which obviously has been pivotal in why we are where we are.)

Did streaming services lull us into a false sense of security?
The fragmentation of TV channels has been happening for decades - first there was one channel, then two, then four, then five, then Sky and cable, then streamers and so on. This graph below from Ofcom shows how since 1988, the main PSB channels have gone from 100% of viewing share to 51% in 2017.

Or here is another visualisation of market fragmentation increasing channels and services, this time in the US for both networks/cable and streamers - and this is unlikely to be a complete picture:

All the while, the TV market has been watching disruptive technology upending other media industries - newspapers, magazines and music, to name just a few. Here is a graphic from eMarketer tracking some of these changes since 2010.

Look at print above - magazines and newspapers. This saw the time their audience spend with their physical publications drop by two thirds in 15 years.
Or below is a graph showing how US music sales by format have changed from the 1980s to 2021.

A key assumption - or hope - has been that the decline of traditional media types doesn’t matter hugely if all that’s happening is people are now consuming the same or similar content on an internet connected device. So yes, print has collapsed but people are now consuming their news from the same sources online. Or as the music graph shows, people aren’t buying CDs but are still listening to music via streaming services.
How the revenue stacks up to replace the old profitable traditional models remains a central question, but not one for this post…
For TV, fragmentation of channels meant broadcasters having many more channels to hold up revenues and profits, usually with lower cost programming, acquisitions or repeats packaged up for specific audiences. The next step for UK broadcasters was through the growth of VOD and streaming services starting in 2006, which enabled TV to grow and adapt to changing technology and audiences behaviours.
The Ofcom graph below shows that TV viewing per day including catchup went down only 7% from 2014 - 2017, and while ‘unmatched viewing’ went up by 56% (which includes gaming, DVDs, SVODs and the like). Some of this will have been professionally produced TV and film content on streamers as well as DVDs and other smart TV apps. Included in this category was YouTube, but again the content watched on that platform would have been a mix of creator, TV and film content.

And then from 2017, you can see the growth of SVODs (subscription streamers like Netflix), going from 18 minutes of all viewing per day, to 37 minutes in 2022.

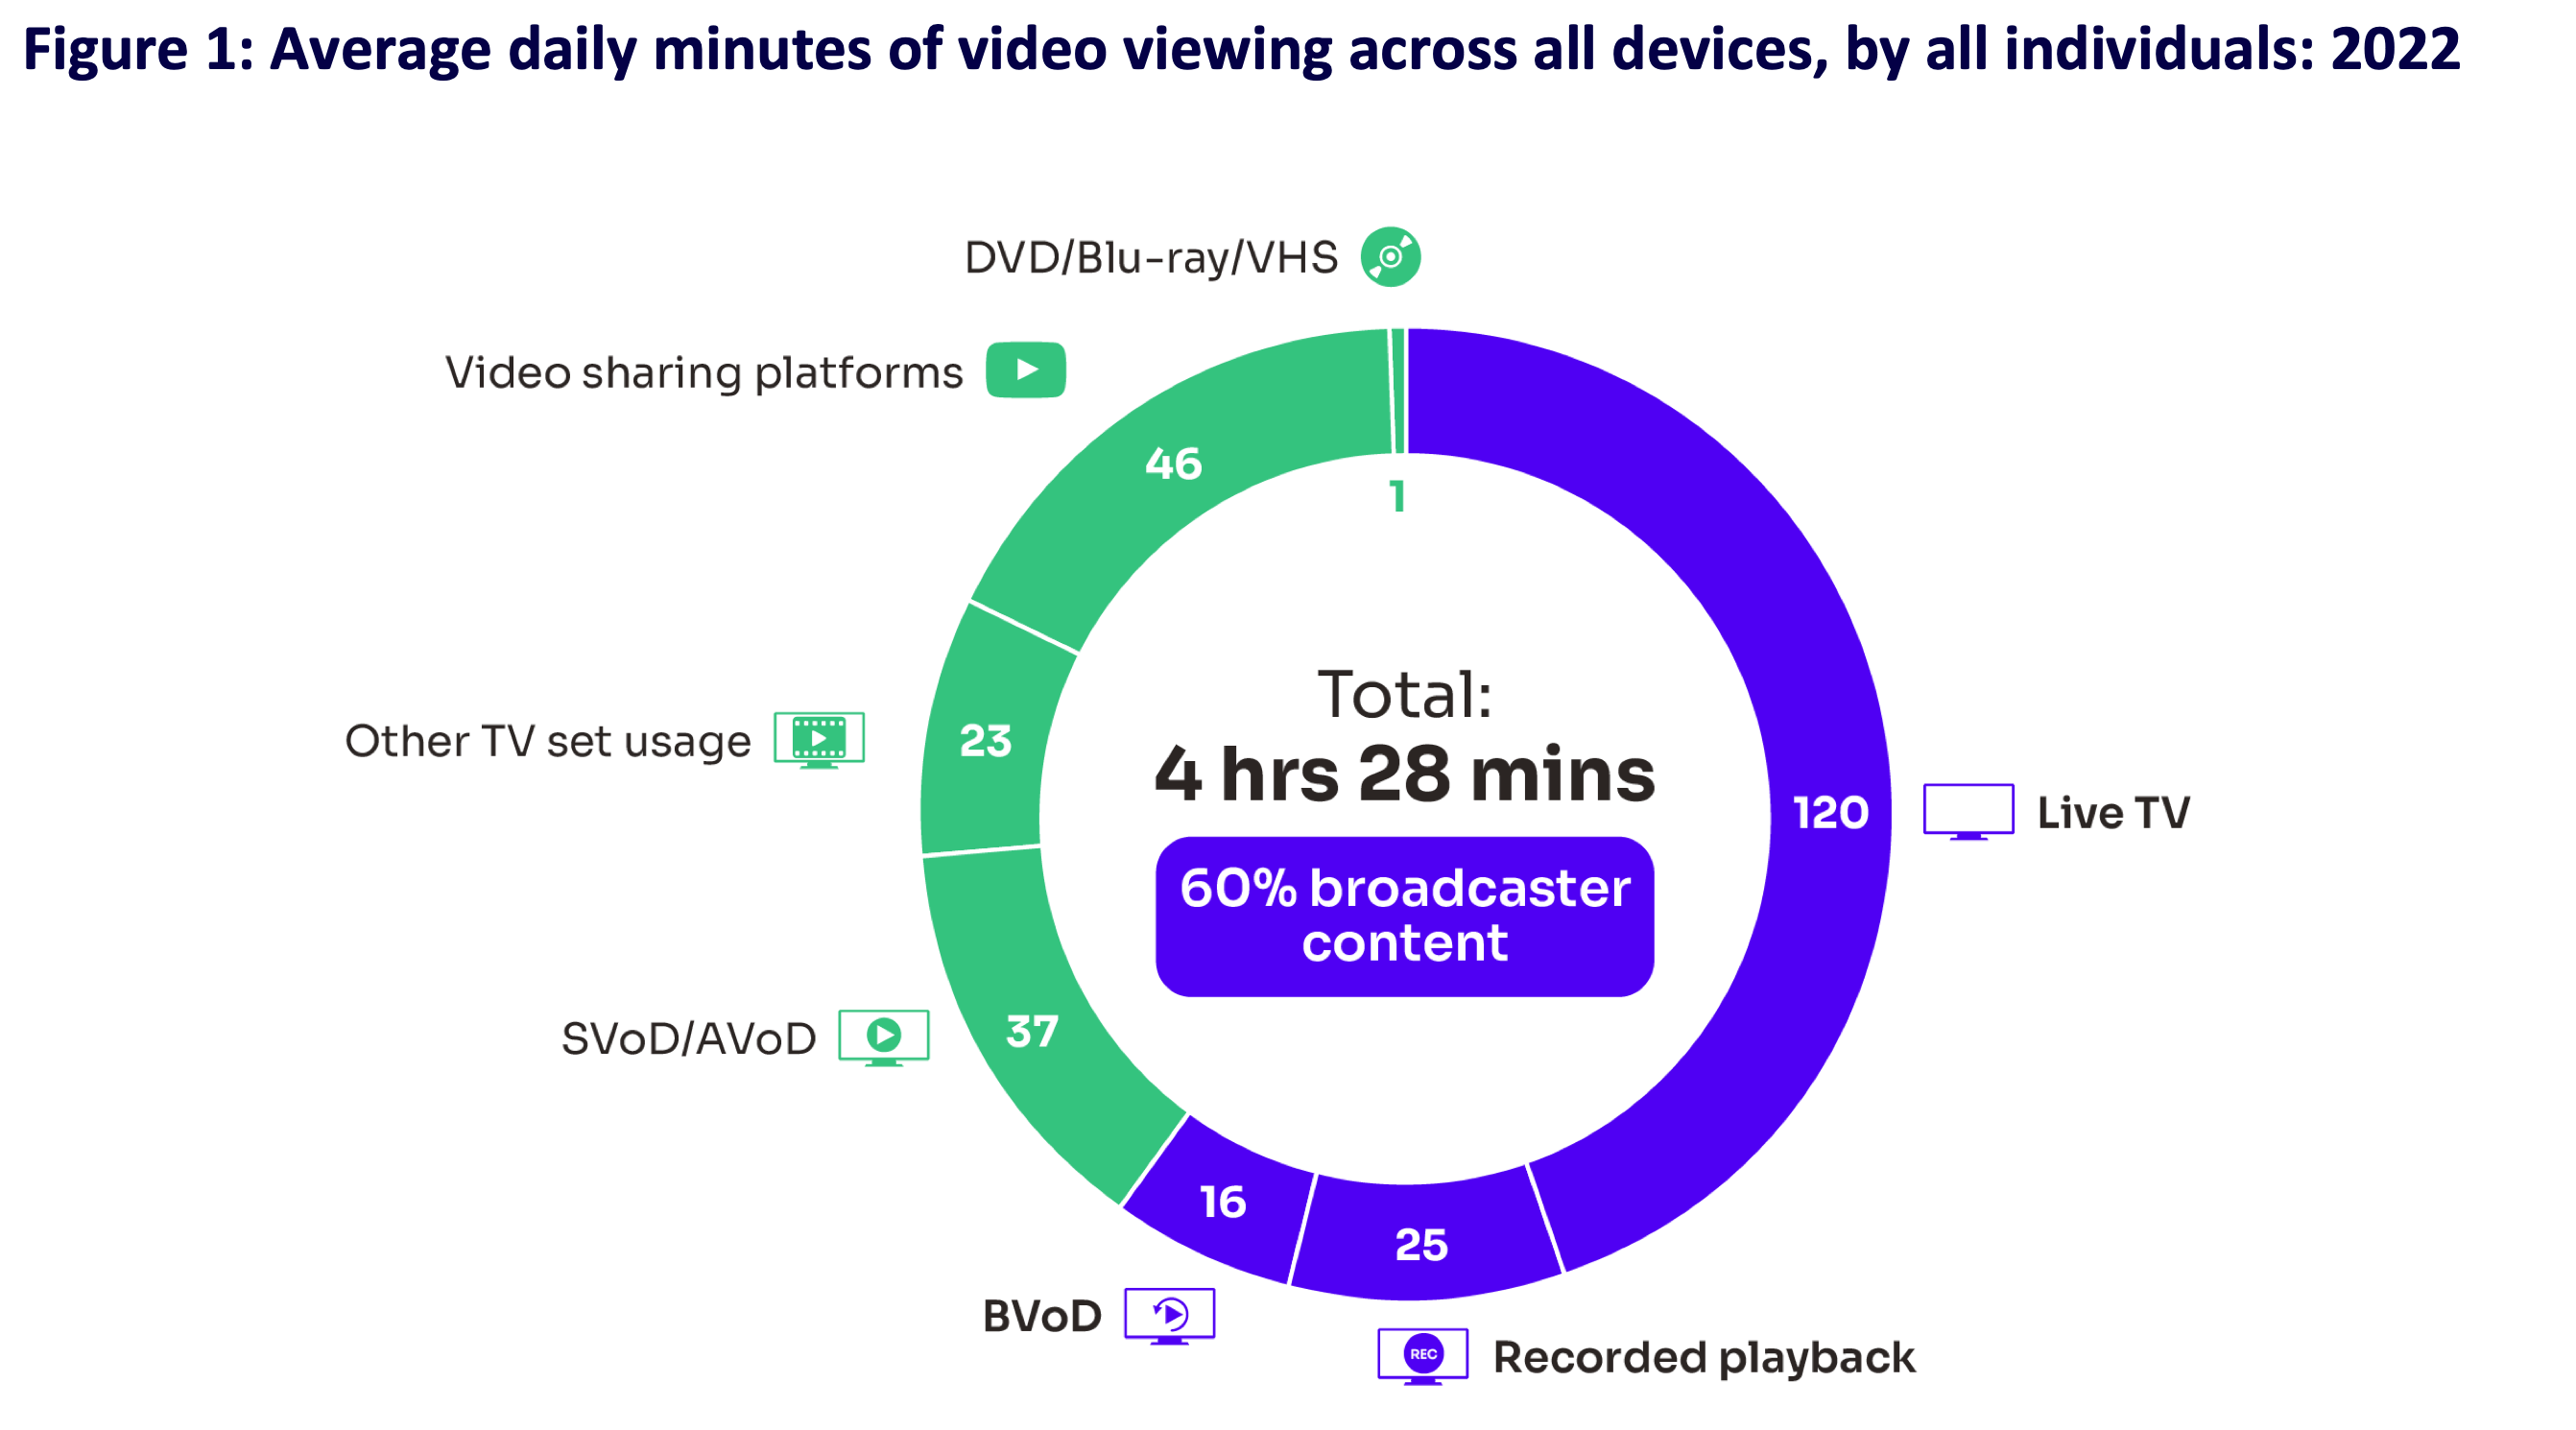
And while it is tricky to make a direct comparison between these two Ofcom Media Nations reports above and below of how much of the viewing is YouTube, we can clearly see the pattern where the percentage of broadcast content is going down overall, and while SVOD/AVOD is growing, so is the consumption on other platforms. And yet while from 2014 to 2017 overall viewing didn’t changed in terms of total minutes - both around five hours per day - it dropped to 4 hours 28 minutes in 2022. Is that a covid related blip or something more permanent?
However, while the above provided some comfort that VOD services were the bridge to the new world, it was the data on younger audiences that was the canary in the coal mine. This graph below from Ofcom in 2018 shows the pattern - 16 - 34s were spending 85% more time watching non-broadcast content across all devices than all individuals. Overwhelmingly it was YouTube attracting them, and this trend has continued as this group has aged up and retained their habits, and new generations have come in to replace them.

Then of course comes the most significant trend for television and film: the connected TV set in the corner of the room. Up until this point, TV, film (and gaming) owned this device, and non-TV content was relegated to mobile, tablets and desktops. However, when TV sets became connected to the internet, then any app or website became available in the living room, including the biggest video beast of them all: YouTube.
Here in 2017 you can see the trend emerging: 40 minutes a day on the TV watching non-broadcast content, and since then, that pink section has only grown.

Below are the latest numbers from the US show the huge growth in viewing minutes per day on connected TVs.

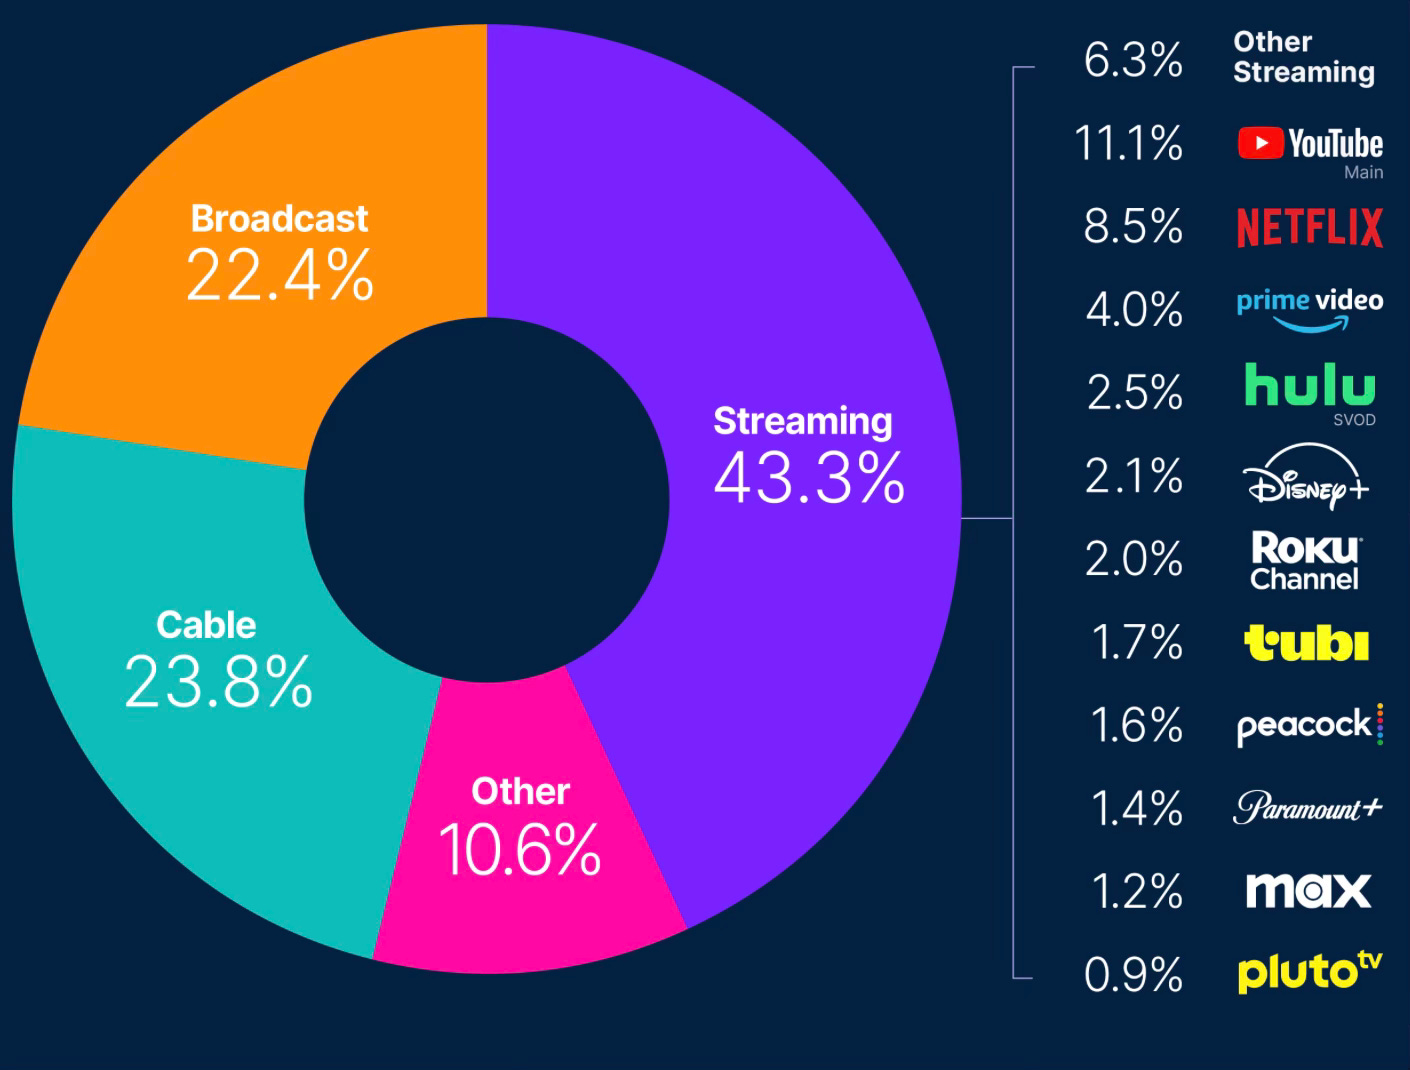
Obviously at the moment, the majority of that viewing on a connected TV device is of TV content from broadcasters, networks and streamers, but when looking at the most recent Nielsen’ The Gauge below, you can see that 11.1% of all viewing in the US is of YouTube. Again, some of that YouTube content will be TV shows, but a lot isn’t.
Final key trend which is why we are where we are: Half of all YouTube views are on connected TV sets, and this behaviour has grown significantly.
The new battle for the living room (and devices, and everywhere else)
What has changed is that previously, TV was a market of itself, where broadcasters competed with each other for audience share and producers competed with each other for commissions. While there was (and remains) a fairly low barrier to entry for TV production companies - after all, anyone with TV production experience, some decent credits and a few ideas can in theory start pitching - there was a more significant barrier to anyone without professional experience to enter the market as a production company. Not impossible, but far less likely.
Now, there are ever more competitors battling it out for audience’s attention, wallets and advertising budgets, and many of these previously wouldn’t be considered part of the TV market - streaming services from a card manufacturer like Hallmark+ or a chicken chain like Chick-fil-A to suggest two new entrants. Even so, much of this increased competition and fragmentation has created opportunities for TV production companies - more places to pitch to, more places to get commissions from, more places to raise finance.
Much more importantly, the convergence of TV and non-TV video services in the connected TV set means that for the first time anyone can and is competing for audience’s attention right there in the living room, in a device that previously was the sole domain for TV and film content (and to a lesser extent, games consoles).
So now TV is competing with the entire creator economy for audience’s attention. YouTube says that 2m creators are earning revenues, and that their partner programme has paid out $30bn in the past three years to creators, artists and media companies - what that split is between the three groups would be telling. And the number of creators is only going to rise as there is no barrier to entry - although whether you are successful is an entirely separate question.
A tricky situation for TV production companies and producers
Arguably TV is now facing the classic innovator’s dilemma: Clayton Christensen’s theory that incumbent companies create high value products, but new competitors serve lower-value customers with poorly developed technologies, and then improve incrementally until they can take market share from the established businesses.
Applying the innovator’s dilemma to the TV sector: TV is a high quality product in comparison to the creator economy - to the extent that up until now, many in the TV industry haven’t seen creators as competitors, rather they are ‘different’ to TV. In addition, for many TV people, they can see YouTube’s revenue model doesn’t even begin to match up to TV budgets. Add in the reality that for many production companies, TV is a low margin game without huge amounts of spare cash to throw around; and together these factors act as a major barrier for production companies to innovate in this space. Obviously broadcasters have deeper pockets, which is why the new ITVX YouTube strategy and Channel 4.0 are important.
However, as creators get better at what they do, they are siphoning off viewers from TV, and where viewers go, so do advertisers, thus putting more downward pressure on TV budgets. And as more and more people are watching both TV and creator content via YouTube and on connected TVs, arguably from an audience perspective the delineation between the two markets and content types is increasingly irrelevant.
Throw generative AI into the mix, and the quality of the content produced by creators is only going to improve. For many creators, success means generating enough revenue to replace (or indeed, supplement) what they earn from their job. So while only a handful of creators will become screamingly wealthy, many are aiming for a more achievable level of income.
So what are the options for TV production companies and producers?
There were 488 UK production companies in 2021, which had risen from 420 in 2012. Production company revenues in 2021 were £6.7bn, expected to rise to £8bn in 2030. Worth noting that these numbers are from Ofcom’s Understanding the UK’s TV production sector report from August 2023 which came out before the market downturn of the past 18 months - so doesn’t reflect that total revenues for production companies fell by £392m in 2023 and commissioning spending shrunk by 10% (although some feel it may be higher when taking into account international commissioning).
Pact’s 2024 census is also worth reading.

In very simple and broad terms, one option for TV producers is to take the view that while things have been sticky for the past year or two, TV is cyclical and will see a return to some sort of normality - not the highs of the streaming war period, but still a really sizeable market. Within this context, while yes, the creator economy will continue to grow and develop, a reasonable strategy is to focus on professionally produced and distributed content and to dominate whatever genre and specialism within that market. Perhaps looking to brands to finance the funding gap and downward pressure on TV budgets that may continue.
A second option for TV producers is to view this situation as an opportunity to expand, and be part of a new generation of TV/creator hybrids that will jostle for position as professionally produced content and creator content converge on the TV set via YouTube. This option would see TV producers competing in both the TV market as well as with the millions of YouTube creators there are in the world.
Both of these paths are legitimate and reasonable options in the face of such uncertainty. However, if you are a producer interested in exploring YouTube, here is a little teaser to next week’s newsletter…
Below is a post that Alex Lieberman wrote this week (he is one of the founders of Morning Brew, the hugely successful business newsletter now owned by Axel Springer and includes podcasts, B2B products and more. It turned over $70m last year).

Of all his predictions, you can probably pick out the ones most relevant to TV production companies and producers, but instead I’m going to write about this one:
Everyone realises we’ve entered the era of the interest graph.
While you may be thinking what is the interest graph when it’s at home, hopefully all will become clear as it could offer a path to help TV producers plan a YouTube strategy that is aligned with their expertise, IP and existing businesses.
That’s it for this week - I thought I’d leave you with these two graphs below showing how TV has disrupted other media - in this case, reading for pleasure.


Follow @businessoftv on Twitter/X, say hi via email hello@businessoftv.com, or connect with me on LinkedIn.
Good insight 😌 Can i translate part of this article into Spanish with links to you and a description of your newsletter?